


As earlier forecasted, El Niño will reach its peak somewhere between late fall and early winter and as we approach the apex of what many are referring to as a “Godzilla” El Niño, here’s what we can expect precipitation-wise out of this year’s historic meteorological phenomena.
In ENSO’s latest blog post, El Niño update: Pumpkin spice, Emily Becker describes the upcoming trend and its correlation to precipitation as variable at best. She admits a ton of variation when looking at previous El Niño events from the past and their subsequent precipitation amounts. However, with all the disclaimers out-of-the-way her finding’s paint a very optimistic picture, especially for Northern California and the Sierra’s.
Below is the average of El Niño years starting in 1950 and their collective precipitation amounts
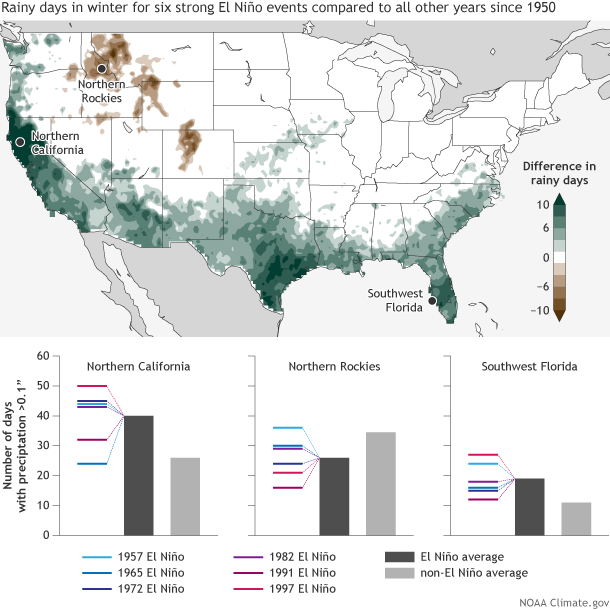
Basically, El Niño years offer an average of 40 precipitous days in northern California during the winter months compared to 29 during a non El Niño year.
“Here’s a fun fact for your next nerdy cocktail party… Boulder, Colorado has registered seven October snowstorms with more than one foot of snow since 1950, every one happening during an El Niño winter.”- Emily Becker (NOAA blogger)
Below is an average of heavy rain days (or days when it will puke) during El Niño years since 1950
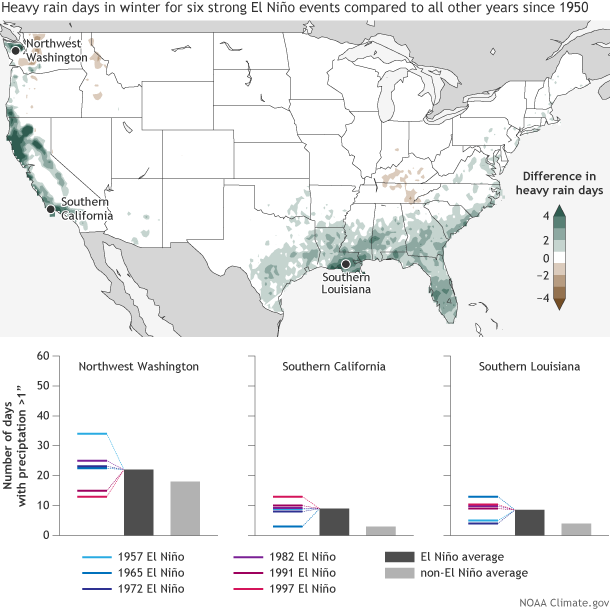
During an El Niño year, heavy precipitation days are more than twice as likely when compared to that of a non El Niño year.
Actually normal years contain 4 days of heavy precip compared to about 8.5 days during an El Niño year! That’s good news for California…
You can read the entire ENSO blog post here: October 2015 El Niño update: Pumpkin spice
