

This post first appeared on the climate.gov website and was written by Emily Becker
La Niña conditions were present in August, and there’s a 75% chance they’ll hang around through the winter. NOAA has issued a La Niña Advisory. Just how did we arrive at this conclusion, and what does a La Niña winter portend? Read on to find out!
Checking the boxes
Let’s revisit our La Niña decision tree.

Flowchart showing decision process for determining La Niña conditions. Figure by Fiona Martin, adapted by Climate.gov.
The answer to the first question, “Is the monthly Niño3.4 sea surface temperature anomaly equal to or less than -0.5°C?” is an easy “yes.” August’s value was -0.6°C according to our most consistent sea surface temperature dataset, the ERSSTv5 (though that is not the only SST dataset we monitor). For a quick refresher, the Niño3.4 sea surface temperature anomaly is the difference from the long-term average temperature of the surface of the Pacific Ocean in the Niño3.4 region. In this case, the long-term average is 1986-2015.
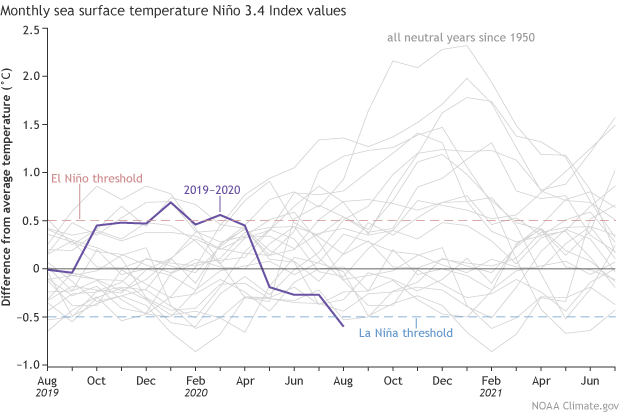
Monthly sea surface temperature in the Niño 3.4 region of the tropical Pacific for 2019-2020 (purple line) and all other years starting from neutral winters since 1950. Climate.gov graph based on ERSSTv5 temperature data.
The second step is “Do you think it will stay more than half a degree cooler than average for the next several months?” and again, the answer is “yes.” Most of the dynamical computer models predict that the sea surface temperature will remain below the La Niña threshold of -0.5°C through the winter.
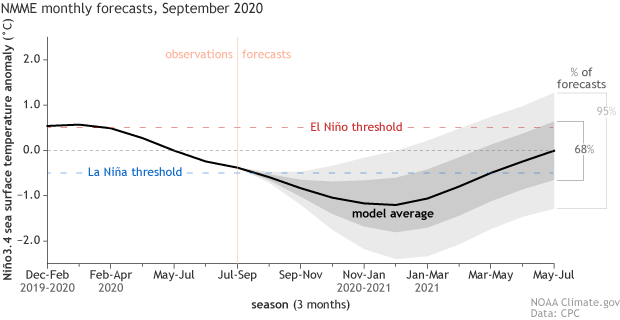
Climate model forecasts for the Niño3.4 Index. Dynamical model data (black line) from the North American Multi-Model Ensemble (NMME): darker gray envelope shows the range of 68% of all model forecasts; lighter gray shows the range of 95% of all model forecasts. NOAA Climate.gov image from University of Miami data.
Now, on to the critical third step: “Is the atmosphere showing signs of a response to the cooler-than-average sea surface?” Another “yes!” La Niña intensifies the contrast between the warm far western Pacific and much cooler eastern Pacific, and so La Niña’s atmospheric response is a strengthening of the Walker circulation. This large-scale circulation pattern is characterized by air rising over the very warm waters of the far western Pacific and Indonesia, traveling eastward high in the atmosphere, sinking over the eastern Pacific, and traveling back westward near the surface. (Creating the trade winds—more on those in last month’s post.)
When the Walker circulation is stronger than average, the trade winds are stronger, which we observed in the end of August and early September. More rising air over the far western Pacific means lower air pressure, while descending air over the eastern Pacific means higher air pressure; the contrast between these two arms of the Walker circulation is measured using the Southern Oscillation Index and the Equatorial Southern Oscillation Index. Both indexes were positive in August, at 1.1 and 1.0 respectively. These values, which are in the top 20% of the 1950–present record, indicate a stronger-than-average Walker circulation.
La Niña impacts
La Niña’s altered atmospheric circulation over the Pacific Ocean affects global weather and climate. While every ENSO event (and every winter!) is different, La Niña can make certain outcomes more likely. This includes more rain than average through Indonesia, cooler and wetter weather in southern Africa, and drier weather in southeastern China, among other impacts.
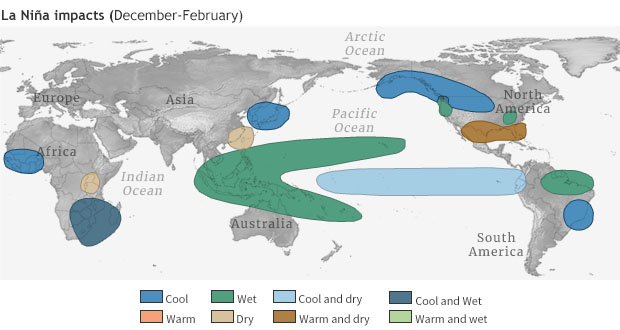
Typical winter (December–February) temperature and precipitation impacts from La Niña. Map by climate.gov.
One important global impact of La Niña is its effect on the Atlantic hurricane season. La Niña reduces wind shear—the change in winds between the surface and the upper levels of the atmosphere—allowing hurricanes to grow. The likelihood of La Niña was factored into NOAA’s August outlook for the Atlantic hurricane season, which favored an “extremely active” season. As of September 8th, we have seen 17 named storms so far this season, and the forecast is for a total of 19-25 named storms (the hurricane season ends on Nov. 30th).
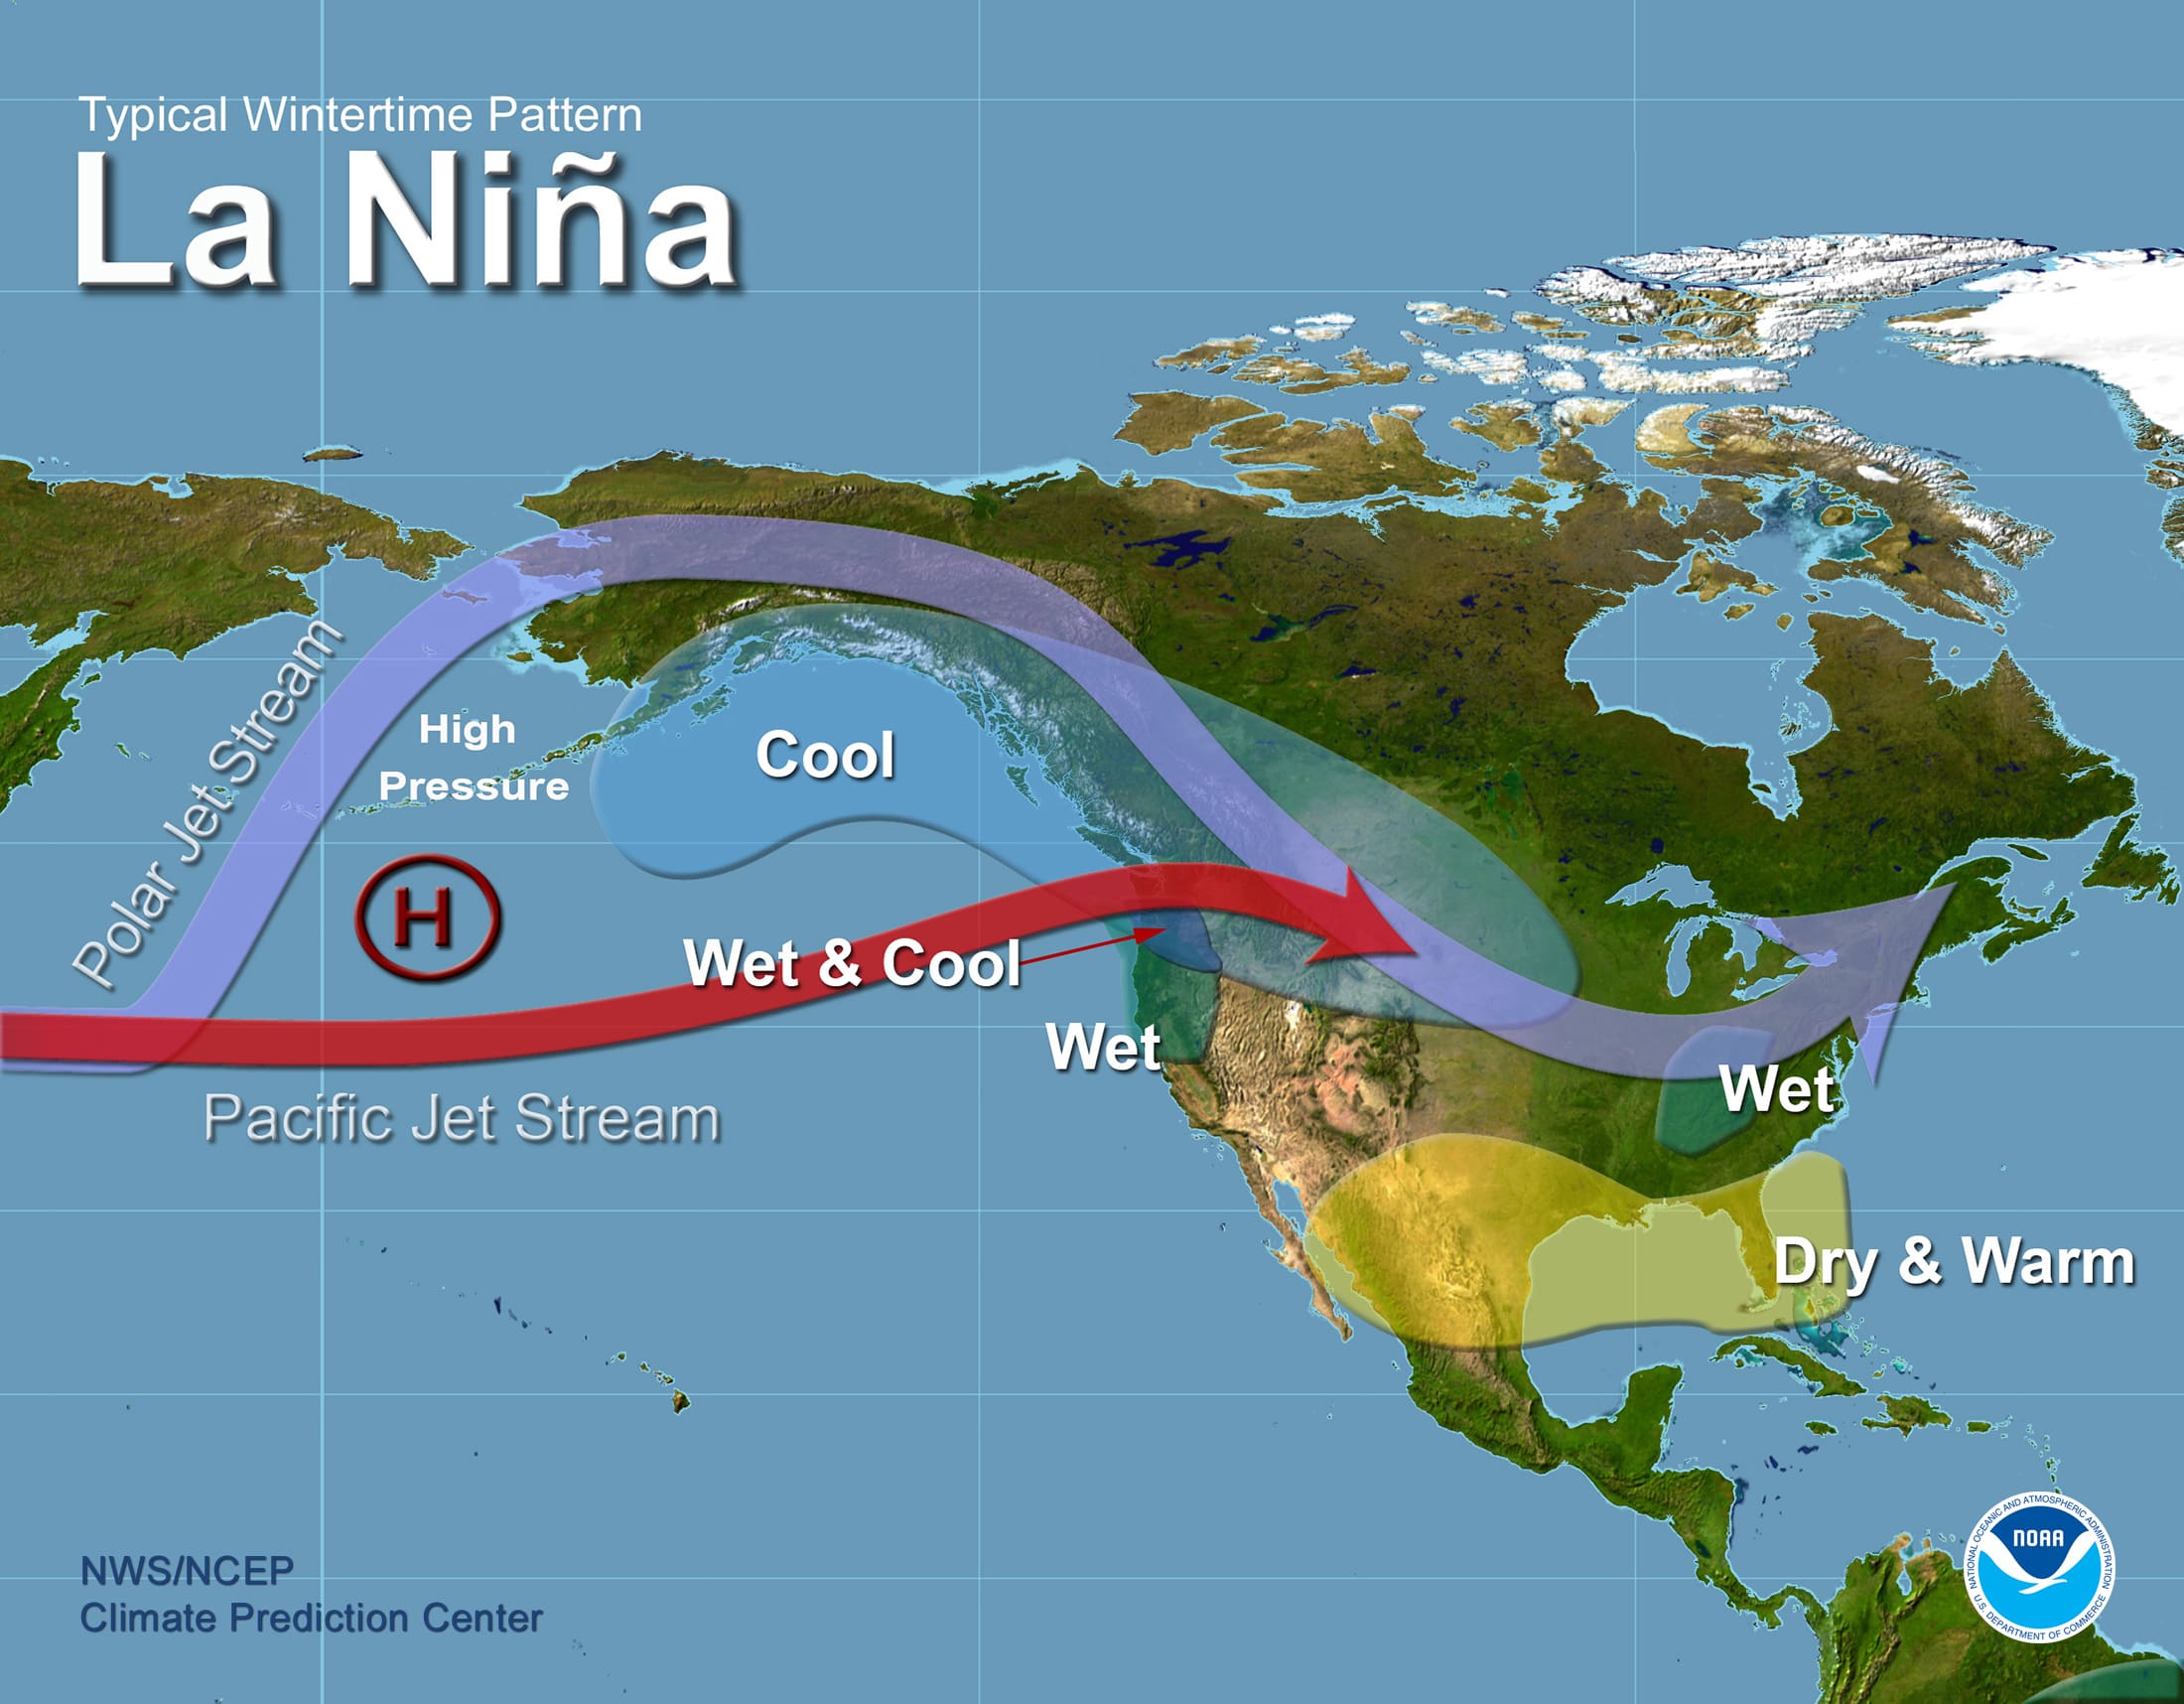
La Niña affects US weather through its impact on the Asia-North Pacific jet stream, which is retracted to the west during a La Niña winter and often shifted northward of its average position. Tom wrote a great explanation of the La Niña/jet stream mechanics and impacts here. Generally, La Niña winters in the southern tier of the US tend to be warmer and drier, while the northern tier and Canada tend to be colder. Official seasonal outlooks are available from the Climate Prediction Center, and Nat will be writing about CPC’s winter outlook for the blog in November.
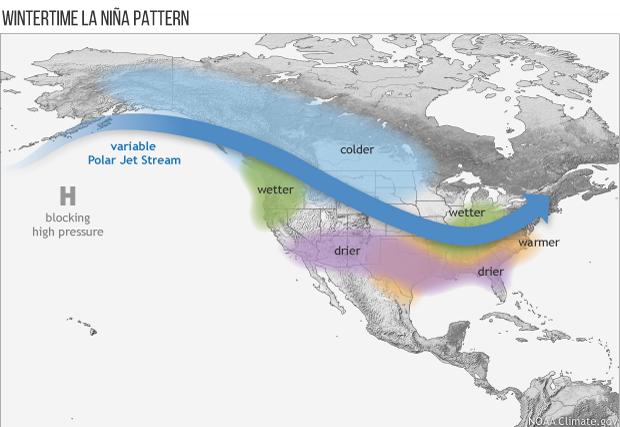
Average location of the jet stream and typical temperature and precipitation impacts during La Niña winter over North America. Map by Fiona Martin for NOAA Climate.gov.
We have a bunch of information on La Niña impacts here on the ENSO Blog! In the early stages of our last La Niña, 2018–2019, Tom mapped out the temperature and precipitation during every La Niña winter on record. Also, guest posts have covered La Niña’s effect on snow in the US, a potential link with tornado season, and how La Niña can interact with other climate variability patterns. And of course, we’ll be here every month, updating you on how ENSO conditions are evolving.