

Report From Climate.gov
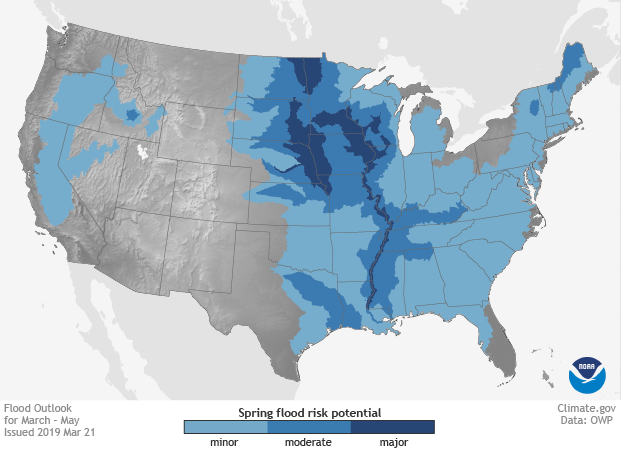
According to NOAA’s spring flood and climate outlook, a wet winter has primed much of the Great Plains for spring flooding in 2019, with major flooding likely along the Red River of the North, the Missouri, and the Mississippi Rivers. Moderate flood risk extends upstream of those rivers to their tributaries, including the lower Ohio, the Cumberland, and Tennessee Rivers. Minor flood risk covers nearly the entire country east of the Mississippi as well as parts of Washington, Oregon, and California.
CONUS map showing areas projected to experience minor, moderate, and major flooding in different shades of blue
U.S. areas at risk of minor (light blue), moderate (blue), and major (dark blue) flooding from March through May 2019. NOAA Climate.gov map, based on data from the NWS Office of Water Prediction.
The wet winter isn’t the only contributor to the expansive flood risk. Across much of the country, the risk of well above average precipitation is elevated. (In any given year, the baseline probability for unusually wet, unusually dry, or near-average seasonal conditions is 33 percent each). For example, a swath of states along the southeastern seaboard and the Gulf Coast have a 40-50 percent chance of seasonal precipitation in the upper third of the climatological record. (That’s compared to a 33 percent chance of near-average precipitation and a 17-27 percent chance of precipitation in the lower third of the climatological record.)
Map of the U.S. with AK and Hawaii insets showing places with higher-than-average chances of having a much wetter than usual spring
Shades of green and brown show the chances of an unusually wet or dry spring (April-May) in 2019. “Unusually wet or dry” means seasonal average precipitation in the top or bottom third of the climatological record (1981-2010). Darker colors mean higher chances (greater confidence in the forecast), not how wet or dry the conditions will be. NOAA Climate.gov map, based on data from the Climate Prediction Center.

Below-average temperatures are most likely in the Central and Southern Plains, where the saturated ground will slow down the seasonal warm up. Odds for a much warmer than average spring are elevated above background probability levels in Alaska (where lack of sea ice in surrounding waters allows more rapid seasonal warming), in areas east of the Mississippi, and in the West and Pacific Northwest.

U.S. map with Alaska and Hawaii inset showing the temperature outlook for April-June 2019
Shades of blue and red show the chances of an unusually wet or dry spring (April-May) in 2019. “Unusually wet or dry” means seasonal average temperature in the top or bottom third of the climatological record (1981-2010). Darker colors mean higher chances (greater confidence in the forecast), not how warm or cool the conditions will be. NOAA Climate.gov map, based on data from the Climate Prediction Center.
For a more detailed discussion of the factors influencing this spring’s seasonal outlook, visit the Climate Prediction Center’s website. For experimental forecasts of departures from average stream flows, explore the interactive map on the Office of Water Prediction Website.