

November 4, 2026 | Snowpack conditions as of November 3, end of day
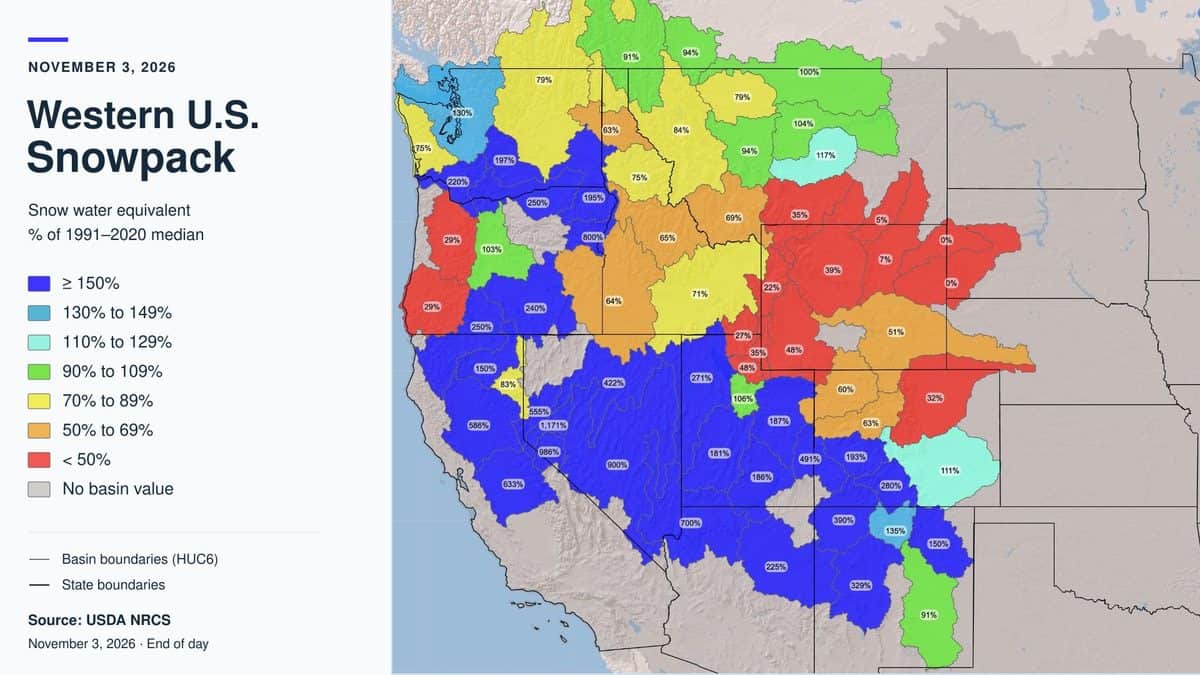
A basin along the California–Nevada border is sitting at 1,171% of its early-November median snowpack. Meanwhile, several Wyoming basins are showing single-digit percentages.
That contrast jumps off the USDA Natural Resources Conservation Service snowpack map. Much of the Sierra Nevada and Great Basin is shaded blue, signaling snow water content above the median for this date. Large portions of Wyoming and northern Utah are red, indicating less than half their typical early-November snow water content.
For skiers watching winter take shape, it is an interesting opening snapshot. But those eye-popping percentages need context: a four-digit snowpack reading in November does not necessarily mean a deep ski base.
The map measures snow water equivalent, or SWE—the amount of water held in the snowpack if it melted. Its percentages compare that water content with the median for the same date during the 1991–2020 reference period. A reading of 100% matches that date’s median; 200% is twice it. SWE measures something different from accumulated snowfall or snow depth on a ski run. Natural Resources Conservation Service
Here is how selected basin readings in the November 3 snapshot compare:
| Region | Selected readings | What stands out |
|---|---|---|
| California and the California–Nevada border | 586%, 633%, 986%, 1,171% | Some of the map’s largest percentages. |
| Washington | 75%, 79%, 130%, 197%, 220% | A mix of below-median and well-above-median basins. |
| Oregon | 29% in western basins; 240% and 250% farther inland and south | A sharp contrast within the state. |
| Idaho | 64%, 65%, 71%, 75%, 84% in several central and eastern basins | Much of the interior trails its median, with higher readings farther west. |
| Montana | 94%, 100%, 104%, 117% in several northern and central basins; 35% farther south | Near-median areas alongside substantial local deficits. |
| Wyoming | 5%, 7%, 22%, 39%, 48%, 51% | Many mapped basins are below half their date-specific medians. |
| Utah | 27%, 35%, 48% in the north; 181%, 186%, 187%, 271% farther south and west | A pronounced divide across the state. |
| Colorado | 60% and 63% in northern/western basins; 193% and 280% farther south | Southern basins are ahead of their own medians while several northern basins trail. |
| Arizona and New Mexico | 225% and 700% in Arizona; selected New Mexico readings from 91% to 390% | Many Southwestern basins are above their early-season medians. |
These are selected watershed values from the supplied map, rather than statewide averages or resort reports. Watersheds can cross state lines. Gray areas indicate no basin value.
California and Nevada supply the most dramatic numbers, but the map also shows why describing an entire state with one percentage can miss the story. Oregon’s western deficits sit beside much higher interior readings. Northern Utah looks very different from basins farther south. Colorado’s southern basins are ahead of their own date-specific benchmarks while several northern basins lag.
There is another wrinkle: early November’s typical snowpack can be very small. NRCS explains that unusually high percentages are common at the beginning and end of the snow season, when the median water content is low. Natural Resources Conservation Service
For a hypothetical example, a basin with a median SWE of just 0.1 inch would reach 1,000% with 1 inch of SWE. That is a substantial increase over its usual amount for the date, but the percentage alone cannot tell you whether the snow is deep enough to cover rocks or open terrain. This example illustrates the math; it is not an absolute SWE measurement from the map.
The same caution applies when comparing regions. A basin at 500% can hold less actual snow water than another at 100% because their historical baselines differ. The colors show how each basin compares with itself for early November, rather than ranking the West’s deepest snowpacks.
For skiing, use this map to follow regional snowpack development, then check the mountain itself. Resort base depths, webcams, open-terrain reports and operating schedules answer different questions from a watershed SWE percentage. A basin shaded blue does not establish that every slope within it has continuous coverage.
Through November, watch whether actual snow depth and SWE continue to build and whether coverage holds between storms. The Sierra and much of the Great Basin have encouraging relative numbers in this snapshot. Wyoming and northern Utah have ground to make up against their early-November medians. The next updates will show how that opening pattern develops.