
Winter Weather Forecast / Prediction / Outlook 2025-2026: Snowfall Outlook Across the U.S. This year’s winter weather snow forecast provides insights into expected snowfall patterns and temperatures.
Today, we bring you the latest insights from Direct Weather detailing the breakdown of the latest snowfall forecast for the upcoming winter, published on September 12, 2025. The forecast compares expected snowfall to annual averages and highlights regional variations. Whether you’re hoping for mammoth snowfalls or dreading shoveling snow, this forecast will give you a clear picture of what to expect.
Understanding Average Snowfall Across the U.S.
Direct Weather’s snowfall forecast begins with a layered map of average annual snowfall across the United States, providing a baseline to compare this year’s predictions. Here’s how the averages break down by region:
- No Snow to Trace Amounts: Areas in the peach-colored “no snow” layer, such as South Florida, southwestern California, and southern Texas, rarely see snowfall. These regions might experience snow once every few decades or even centuries, with areas closer to the gray zones seeing a dusting every other year or every three years.
- Trace to 3 Inches: The gray areas, often near the peach borders, typically see a trace to up to 3 inches of snow annually. Northern parts of these zones, closer to the white band, approach the 3-inch mark.
- 3 to 6 Inches: The white band, though thin, indicates regions that average 3 to 6 inches of snow each year. These areas are scattered across parts of the country, transitioning from lighter to moderate snowfall.
- 6 to 12 Inches: The light blue layer covers regions expecting 6 to 12 inches of snow annually. This band remains relatively thin but includes parts of the central U.S.
- 12 to 24 Inches: The medium blue layer, covering roughly half the nation, includes states like Kansas, Missouri, southern Illinois, southern Indiana, southern Ohio, Kentucky, Tennessee, and much of the Mid-Atlantic. These areas see 12 to 24 inches of snow on average.
- 24 to 36 Inches: The darker blue layer, encompassing about 40-50% of the U.S., includes the northern plains, central Midwest (e.g., Iowa, southern Wisconsin, northern Illinois, northern Indiana, northern Ohio), and hilly, higher-elevation areas in the East. This layer represents significant snowfall.
- 36 to 48 Inches: Three distinct regions fall into this category: the mountainous West (including plains just east of the Rockies), the upper Midwest and Great Lakes, and parts of the Appalachian Mountain Range and New England. These areas see substantial snow accumulation.
- 48 to 72 Inches: This layer includes high-elevation areas in the Cascades, Sierra Nevada, and Rockies, as well as northern Minnesota, northern Wisconsin, Michigan’s Upper Peninsula, and parts of the Lower Peninsula. Lake-effect snow significantly boosts totals in these regions, with coastal areas of Massachusetts, New Hampshire, and Maine also included due to frequent heavy snow events.
- 72 Inches and Above: The red “overachiever” layer highlights areas with extreme snowfall, often exceeding 100 inches annually. This includes high-elevation regions in the Cascades, Sierra Nevada, Rockies, and parts of the Great Lakes (e.g., Wisconsin, Michigan, and northern Minnesota). In the Northeast, high-elevation areas like the White Mountains, Green Mountains, Adirondacks, and northern coastal Maine also fall into this category, driven by lake-effect snow and frequent coastal storms.
Note on Western Forecasts: Forecasting snowfall in the West, particularly in mountainous areas like the Rockies, Nevada, and Cascades, is challenging due to elevation-driven variability. The forecast is more accurate for flatter regions like the central and eastern U.S., where the Appalachian Mountains are easier to predict than the scattered Western ranges.
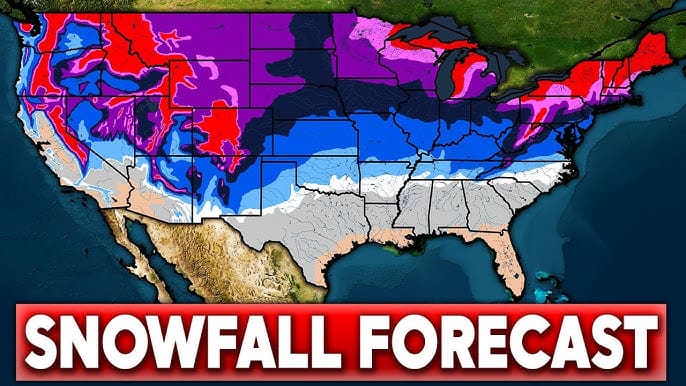
Snowfall Chance Forecast: Above or Below Average?
This winter’s snowfall chances are influenced by a likely weak La Niña or neutral ENSO (El Niño-Southern Oscillation) leaning toward La Niña. This pattern typically suppresses storm tracks in the Southwest, redirecting storms through the Northwest and into the central U.S. Here’s how this impacts snowfall chances compared to averages:
- Below Average Snowfall Chances:
- Southwest (California, Nevada, Utah, Arizona, New Mexico): These areas, particularly the mountainous regions, have a higher confidence level for below-average snowfall. Despite this, their high average snowfall (often 24-72 inches or more) means even a below-average year will still bring significant snow compared to most of the U.S.
- Far Southwest: The further southwest you go, the lower the snowfall chances, with a third layer of confidence indicating a stronger likelihood of reduced snow.
- Above Average Snowfall Chances:
- Northwest and Areas East of the Rockies: The Northwest, northern plains, upper Midwest, Ohio Valley, Great Lakes, northern Mid-Atlantic, and New England have an above-average chance of snowfall. This is driven by below-normal temperatures expected across most central and eastern states, a key factor for snow production.
- Central and Eastern States: A second and third layer of confidence highlights the northern plains, upper Midwest, Ohio Valley, Great Lakes, and Northeast, where below-normal temperatures and above-normal precipitation create ideal conditions for heavy snow. The northern regions, in particular, have a fourth layer of confidence (out of five) for significantly above-average snowfall chances due to the combination of cold temperatures and increased precipitation.
- Deep South and Southeast: These areas are less likely to see above-average snowfall due to average or slightly below-average precipitation, despite cooler temperatures.
Timing Challenges: Snowfall forecasts are complex because timing is critical. Below-average temperatures and above-average precipitation don’t guarantee more snow if cold air and precipitation don’t align. Direct Weather’s “snowfall chance forecast” accounts for this by focusing on the likelihood of snow rather than precise totals.
Why This Forecast Matters
The interplay of temperature and precipitation is key to understanding this winter’s outlook:
- Eastern U.S.: Colder-than-normal temperatures increase snowfall chances, especially in the northern plains, upper Midwest, Great Lakes, and Northeast, where above-average precipitation further boosts the odds.
- Western U.S.: Precipitation plays a larger role in mountainous areas, where it’s typically cold enough for snow regardless of temperature anomalies. However, reduced storm activity in the Southwest lowers snowfall chances there.
Stay Updated with Direct Weather
For a deeper dive into the full winter forecast, including temperature, precipitation, and more, check out Direct Weather’s recently updated video on their platform. They also plan to release a “first snowfall” video soon, so stay tuned for more insights. To get a personalized snowfall forecast for your location, engage with Direct Weather by commenting your location, liking their videos, and subscribing.
Final Thoughts
The 2025-2026 winter season promises a varied snowfall landscape across the U.S. While the Southwest may see less snow than usual, the Northwest, northern plains, upper Midwest, and Northeast are poised for potentially heavy snowfall, driven by cold temperatures and ample precipitation. Whether you’re preparing for ski trips or snow removal, this forecast offers a solid foundation for planning. Keep an eye on Direct Weather for daily updates and region-specific insights to stay ahead of the season’s snow.