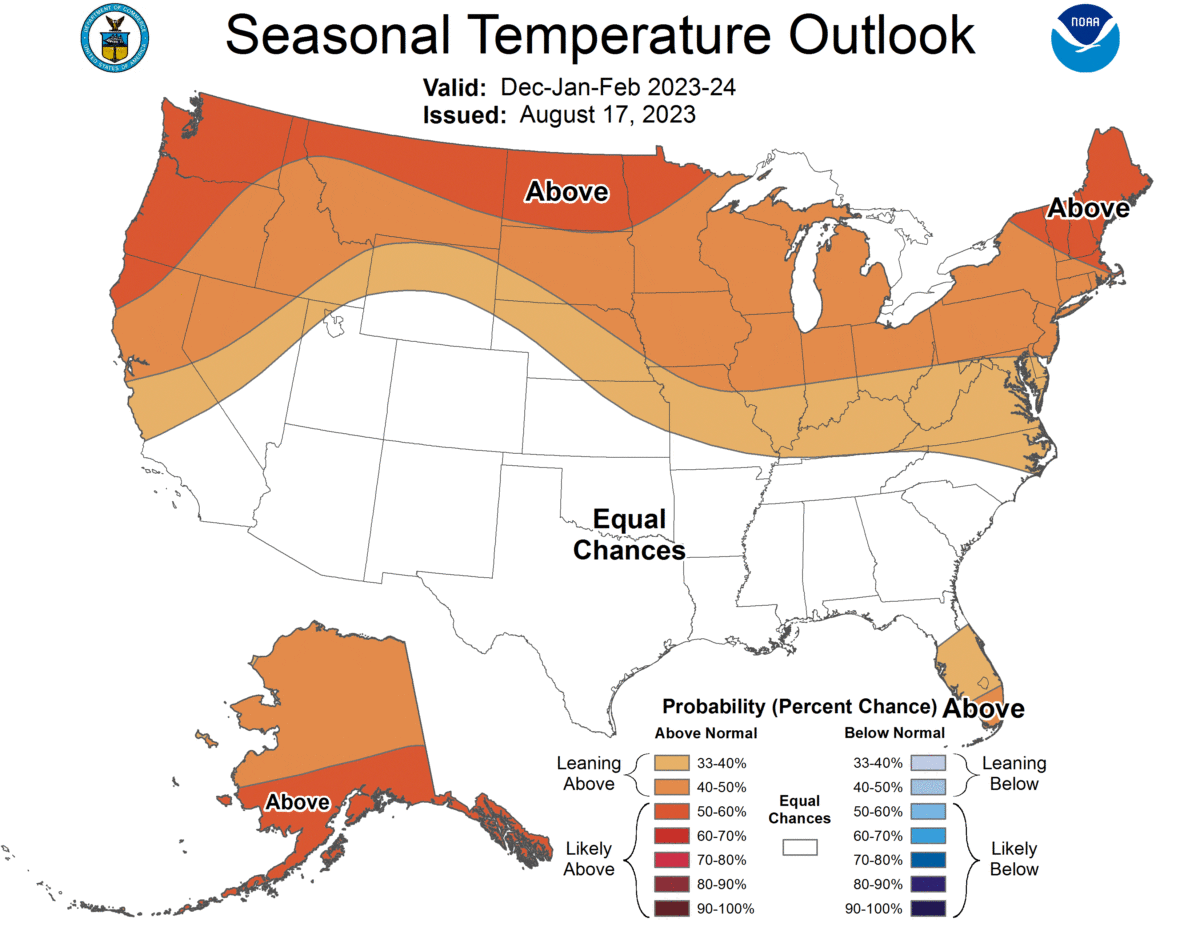
Bit outta my depth when it comes to meteorological tools used to derive this long range forecast issued by the The National Oceanic and Atmospheric Administration (NOAA) but the images of their temperature and precipitation predictions are easy enough to follow.
Looks like NOAA is calling for above average temps for the majority of the North from the beginning of December through the end of February. Precipitation during that same 90 day period is predicted to be 50% chance of being about equal to the historic average for much of the country where we might go skiing excluding Washington State and the far Northern latitudes of Idaho, Montana down through Wisconsin and Michigan where it is predicted to be bellow average.
RELATED: The Old Farmer’s Almanac Winter Forecast 2023–2024
Like all long range forecasts, we should take NOAA’s with a grain of salt as they tend to be a bit of a crap shoot but its interesting to see what how the an agency within the United States Department of Commerce thinks winter will go.

HOW TO INTERPRET NOAA FORECAST MAPS:
The contours on the map show the total probability (%) of three categories, above, indicated by the letter “A”, below, indicated by the letter “B”, and the middle category, indicated by the letter “N”. At any point on the map, the sum of the probabilities of these three categories is 100%.
For any particular location, and season, these three categories are defined from the 30 observations from 1981-2010. The coldest or driest 1/3 (10 years) define the B category, the warmest or wettest 1/3 (10 years) define the A category, and the remaining 10 years in between define the middle (N) category.
When the forecasters decide that one of the extreme categories, say above (A), is the most likely one, they assign probabilities which exceed 33.33% to that category, and label the map with an “A” in the center of the region of enhanced probabilities. To make it possible to display three categories on one map, we assume that, when either A, or B is the most likely category, the probability of the middle category remains at 33.33% for most situations. This means, for example, that when the probability of A (B) is 40%, the probability of N is 33.33%, and the probability of B (A) is 100% minus 40%+33.33%=26.67%.
When probability values of the favored category reaches 70%, or higher, the probability of the opposite category is fixed at 3.3%, and the probability of the middle category is adjusted to values (less than 33.33%) which cause the sum of the three probabilities to equal 100%.
When the middle category (N) is higher than 33.33%, the probabilities of the A and B categories decline by (equal) amounts required for the sum of the A, N, B probabilities to equal 100%.
In regions where the forecasters have no forecast tools which favor the chance of either A, or B, the chance of these two categories is defined to be 33.33% each, and the region is labeled “EC”, which stands for equal chances.
Shading is used to indicate different levels of probability above 33.33%.


