[Report courtesy of NOAA]
A La Nina climate pattern has arrived and is likely to persist through the winter, according to an advisory issued by NOAA’s Climate Prediction Center today. Scientists say there is a greater than 50-percent chance La Nina will also be in place February through April 2018.
Related: 2018 Winter Weather Forecast | Long Range Prediction From NOAA
This is the second winter in a row with a La Nina, and like last year, forecasters expect this one to be weak. Last year, this weather phenomenon extended from July 2016 to January 2017 before a return to neutral El Nino Southern Oscillation (ENSO) conditions.
La Nina: What it is, and what can we expect
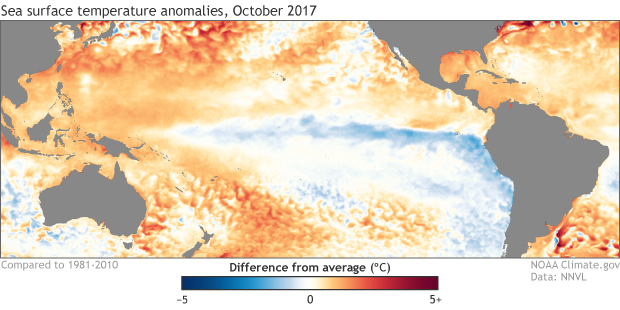
La Nina (translated from Spanish as “little girl”) is a natural ocean-atmospheric phenomenon marked by cooler-than-average sea surface temperatures in the central Pacific Ocean near the equator, the opposite of El Nino (“little boy”).
“It’s here! #LaNina conditions are observed, and have a 65-75% chance of continuing through the upcoming Winter” – NWS Climate Prediction Center
Typical La Nina patterns during winter include above-average precipitation and colder-than-average temperatures along the northern tier of the U.S. and below-normal precipitation and drier conditions across the South. NOAA’s 2017 Winter Outlook anticipated that a weak La Nina was likely to develop. Therefore, significant changes are not expected when the Winter Outlook is updated on November 16.
Full ENSO Blog Post:
11/8/17
Well, it’s November, and the CPC/IRI ENSO forecast is declaring the presence of La Niña conditions! I could just link to my November 2016 post and head home for the day… but that would be no fun! There’s about a 65-75% chance that La Niña conditions will continue at least through the winter. As we head into our fifth “double dip” La Niña (an unofficial term for when neutral conditions briefly prevail in between La Niña winters) in the historical record, let’s dig into what we talk about when we talk about La Niña.

October 2017 sea surface temperature departure from the 1981-2010 average. Graphic by climate.gov; data from NOAA’s Environmental Visualization Lab.
A quick flashback:
If you recall, last month there were several signs of the presence of La Niña conditions. East-central tropical Pacific sea surface temperatures were cooler than the long-term average, accompanied by signs of a La Niña-like atmospheric response (more clouds and rain over Indonesia, less over the central Pacific).
Sea surface temperatures in the Niño3.4 region during September came in at about 0.5°C cooler than the long-term average, the first step in our La Niña conditions decision tree. However, the sea surface temperature was showing some volatility, and we just weren’t confident enough in the second step of the flowchart—that the cooler sea surface would persist for several seasons—to be sure that La Niña’s seasonal pattern had locked in.

What’s different this month?
In October, despite an active Madden-Julian Oscillation moving through the western Pacific (more on that in a minute), La Niña conditions dominated. Stepping through our flowchart, the sea surface temperature in the Niño3.4 region again averaged about 0.5°C cooler than average (check). Most of the computer models forecast that it will remain in weak La Niña territory (between 0.5°C and 1.0°C below average) through the spring (check).
Another factor bolstering forecasters’ confidence that La Niña will remain in place through the fall and winter 2017/18 is the substantial quantity of cooler-than-average waters below the tropical ocean surface. This will provide a source of cooler waters to the surface over the next few months.

(Still not quite sure what you’re looking at? Read more about Hovmoller diagrams.) NOAA Climate.gov image, based on data provided by the Climate Prediction Center.
Finally, the signs of an atmospheric response I described above continued to be present during October (check). In addition to the clouds and rain pattern, the upper-level winds were stronger than average, another sign of a strengthened Walker Circulation. Also, the Southern Oscillation Index was positive, also indicating a stronger-than-average Walker Circulation. Add it all together, and you get… La Niña!
You promised me an MJO!
Indeed I did. The Madden-Julian Oscillation operates on subseasonal timescales, meaning on the order of weeks or months. The MJO is essentially an area of enhanced convection, storms and clouds that moves eastward along the equator, and can circle the globe in around 4-8 weeks. ENSO (the whole El Niño/La Niña system), on the other hand, is a seasonal, stationary pattern, lasting for at least several months in a row.
The MJO can move through the tropical Pacific and temporarily change conditions, including the winds near the surface.

The near-surface winds in the tropics, called the trade winds, have a close relationship to the surface temperature of the ocean. The trades normally blow from east to west, helping to cool the surface and keep warmer water “piled up” toward Indonesia. If these winds relax, the surface waters in the central and eastern Pacific can warm up. This is a critical feedback mechanism for ENSO.
During La Niña, the trade winds are stronger than average, keeping the surface waters cooler (vice versa during El Niño). If the MJO is active, it can temporarily change the wind patterns. This past month, the MJO was active and moved through from the Indian Ocean into the western hemisphere, weakening the surface winds. But despite the winds temporarily weakening due to the MJO, the ocean remained cool. This leads forecasters to believe that La Niña conditions are in place and we can now see the forest for the trees.
This winter’s La Niña, although expected to remain weak, is likely to have some effect on North American weather and climate this winter. Be sure to check out Mike’s recent post for details on NOAA’s 2017/18 Winter Outlook, and stay tuned to the ENSO Blog for further updates on the great La Niña of 2017/18.
Also Read: 2018 Winter Weather Forecast | Long Range Prediction From NOAA


